Area Plots

Dependencies
Introduction
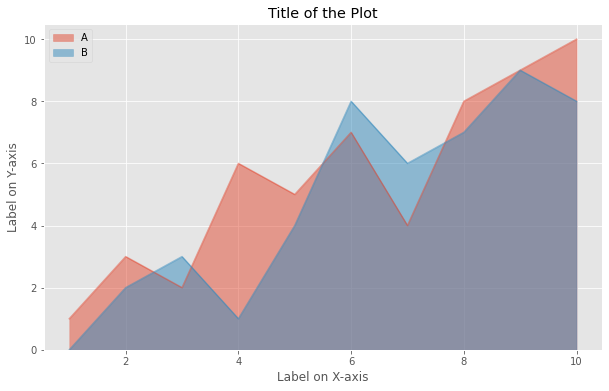
An area chart or area graph displays graphically quantitative data. It is based on the line chart. The area between axis and line are commonly emphasized with colors, textures and hatchings. Commonly one compares two or more quantities with an area chart.
The Notebook here contains the code of area plots like the one shown below.